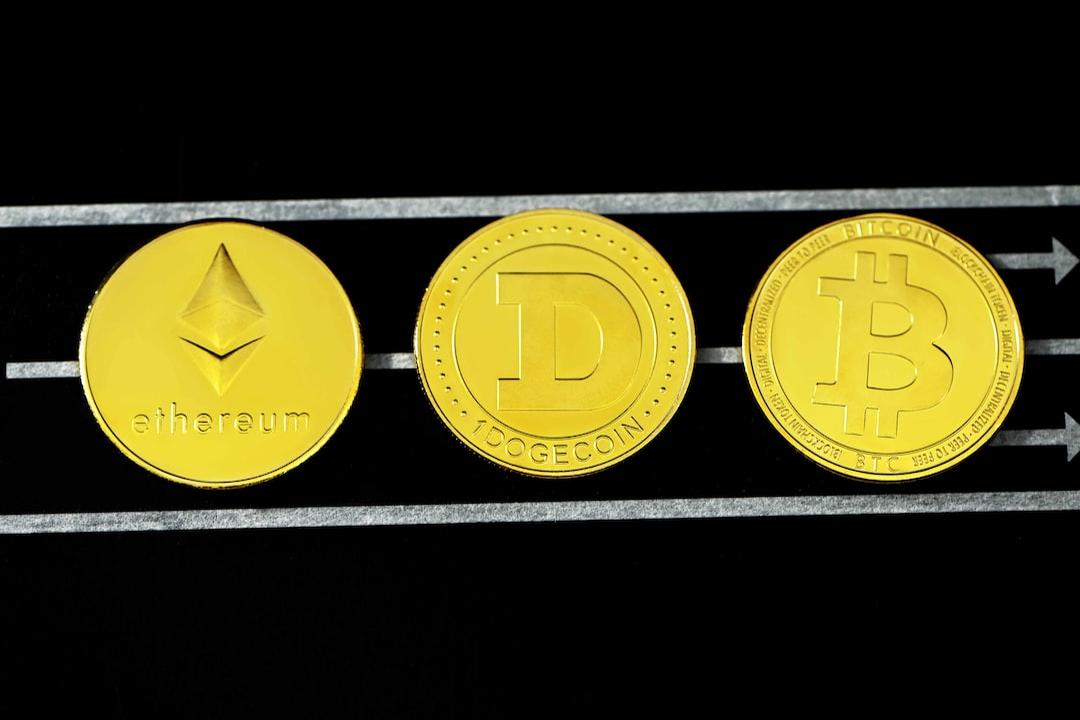
Today’s market session has witnessed a dominant presence of bears, reflected in the global market cap decline. The total market cap stood at $2.31 trillion at the latest update, marking a 0.62% decrease over the past 24 hours. Concurrently, trading volume reached $53.4 billion during the same period, indicating a 0.66% increase.
Bitcoin Price Analysis
Bitcoin (BTC) experienced losses in today’s trading session, evident from its price movements. A detailed examination reveals that the Alligator indicator shows a bearish sentiment, with the Jaw (blue line) positioned below both the Teeth (red line) and Lips (green line). Despite trading below these moving averages, recent convergence suggests a potential consolidation or a slowdown in bearish momentum. Meanwhile, the Money Flow Index (MFI) at 52.10 indicates a neutral stance, reflecting balanced buying and selling pressures. As of the latest report, Bitcoin traded at $61,848, marking a 2.8% increase over the last 24 hours.

4-hour BTC/USD Chart | Source: TradingView
Ethereum Price Analysis
Ethereum (ETH) also faced declines today. Detailed analysis indicates Ethereum’s price hovering around the middle band, signifying equilibrium between buyers and sellers. The upper and lower bands act as resistance and support levels, standing at $3,504.64 and $3,355.27, respectively. The Volume Oscillator displayed a -12.01% change, hinting at reduced trading volume that often precedes a breakout. Ethereum traded at $3,409 as of the latest update, marking a 1.51% decrease over the past 24 hours.

4-hour ETH/USD Chart | Source: TradingView
zkSync Price Analysis
zkSync (ZK) encountered corrections in today’s trading session. Analysis reveals the Supertrend indicator signaling a sell position, with the Supertrend line above zkSync’s current price of $0.1764 USDT. Other indicators, such as the Woodies Commodity Channel Index (CCI) at -71.6279, indicate bearish momentum below the -100 threshold, suggesting ongoing downward pressure. As of the latest report, zkSync traded at $0.1758, marking a 6.9% decrease over the last 24 hours.

4-hour ZK/USDT Chart | Source: TradingView
Worldcoin Price Analysis
Worldcoin (WLD) also recorded losses today. Detailed scrutiny shows Worldcoin’s price below the Kumo Cloud, with the conversion line (blue) positioned below the baseline (red), reinforcing a bearish outlook. Conversely, the Average Directional Index (ADX) at 48.33 indicates a strong yet bearish trend. As of the latest update, Worldcoin traded at $2.25, marking a 0.7% decrease over the past 24 hours.

4-hour WLD/USDT Chart | Source: TradingView
Toncoin Price Analysis
Toncoin (TON) emerged as one of the few gainers today. In-depth analysis reveals the Auto Pitchfork tool illustrating an upward channel, with Toncoin’s price currently at the upper boundary around $8.041 USDT. The Awesome Oscillator (AO) shows green bars above the zero line, signaling bullish momentum. A potential break above the upper pitchfork boundary could indicate continued bullish movement. As of the latest report, Toncoin traded at $8.04, marking a 4.79% increase over the last 24 hours.

4-hour TON/USDT Chart | Source: TradingView

